
DEEP DIVE · FOUNDATION STUDIO
Every number has a chain. Studio lets you walk it.
A KPI or a prediction at the top of a tree of hundreds of computes, several dependencies deep, feeds an app or a six-figure decision. Foundation Studio is where the Domain — a complete digital twin of your operation — gets built, and where that number gets taken apart: every compute, every input, every historical run, back to the sensor.
- Every numberevery compute, every input, every historical run, back to the sensor.
- Unit of Worka record of when it ran, what it read from each input, what it wrote, and how long it took.
- Replayrerun the tick from the same panel, or replay a range
- Level 3Foundation is engineered for Level 3; Studio is the window the supervising will be done through.
The number at the top of the tree
Picture the compute tree behind one plant KPI. Sensors feed computes. Those computes feed others. Several levels up sits the number that matters — a performance index, a prediction, a recommended setpoint — and it goes straight into an application, or into a decision worth $100,000. Then one morning someone says: that number does not look right.
In most stacks that question costs a week. Which notebook produced it? Which version? Which input was stale that day, and what did the model actually read? The chain exists only in the heads of the people who built it, and the history is gone the moment the next run overwrites it.
A number you cannot take apart is a number you cannot defend.
ONE NUMBER, WALKED BACK
Walk the chain
In Foundation every compute runs on the orchestrator's tick, and every tick is a Unit of Work: a record of when it ran, what it read from each input, what it wrote, and how long it took. Studio is where you read those records. When a number looks wrong:
-
STEP 01
Start at the number.
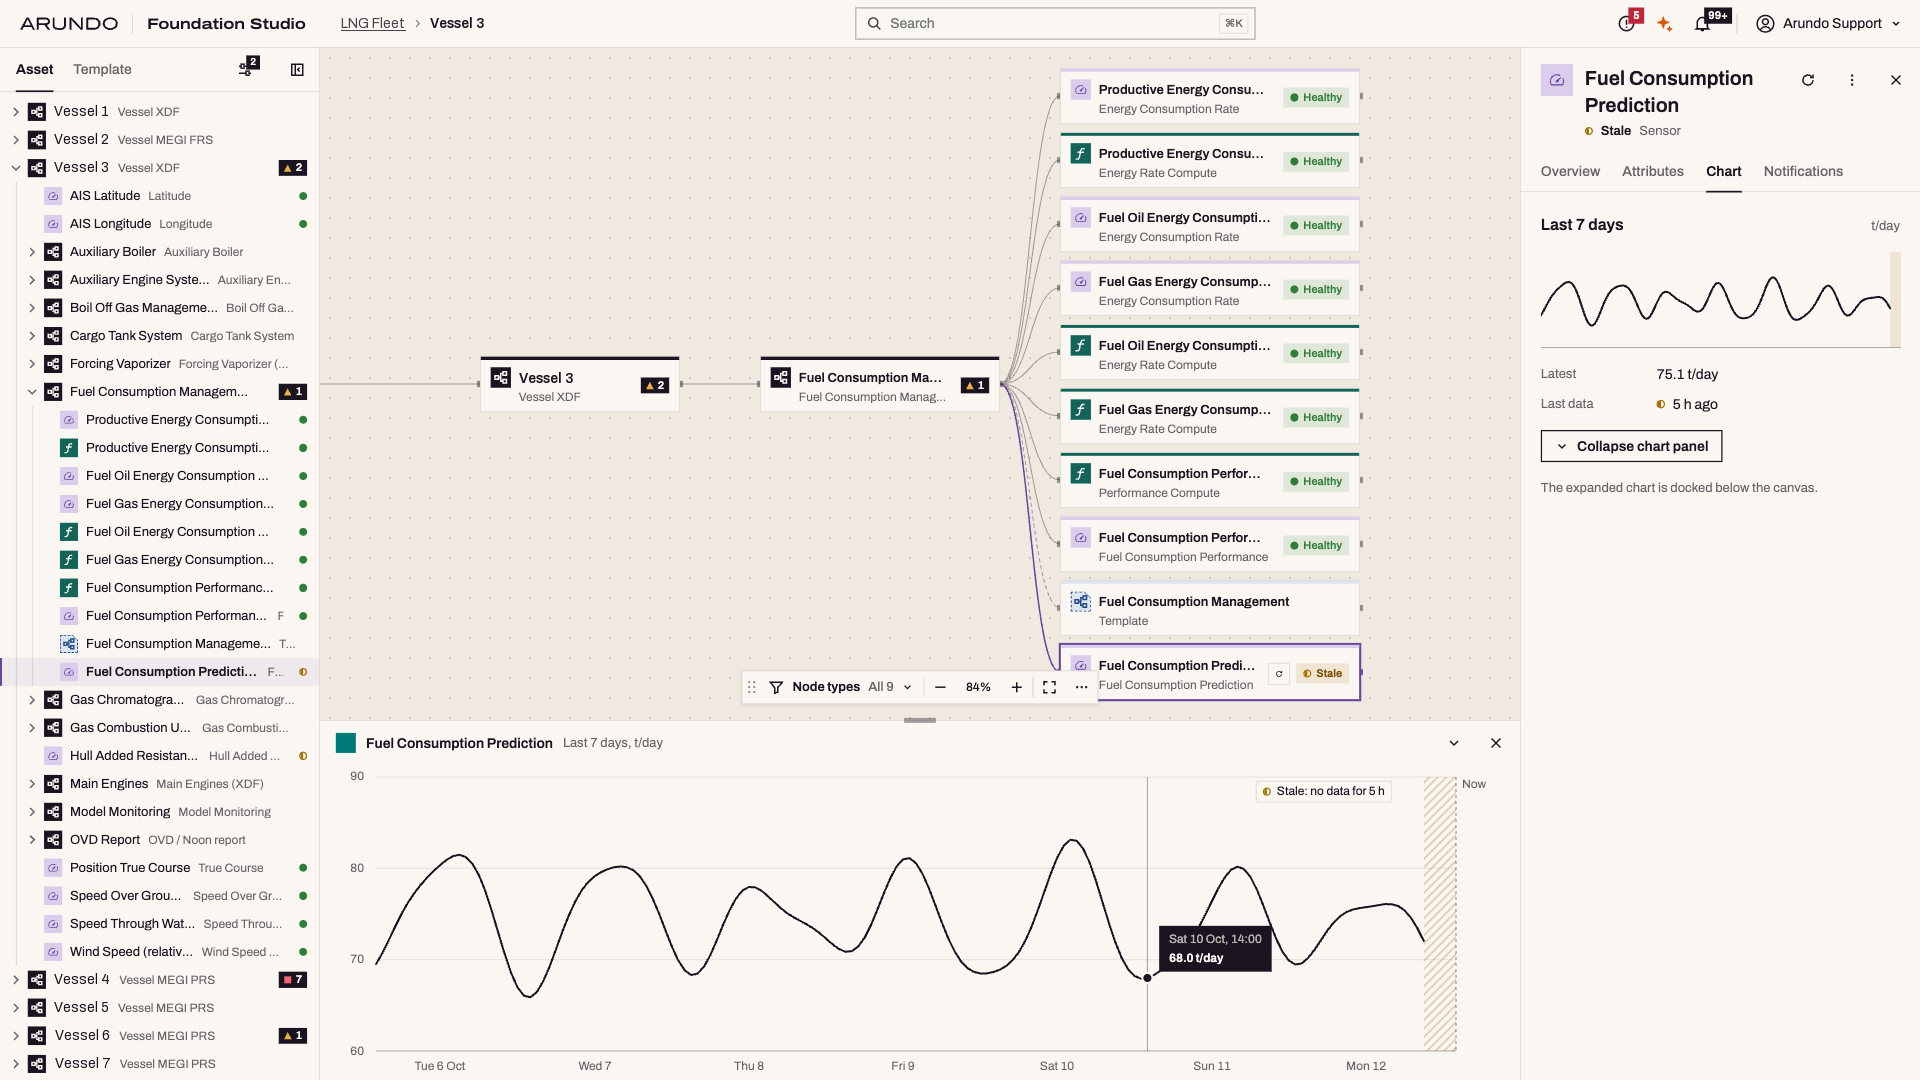
Open the sensor it lives in. The chart shows when it changed; the status says whether the data is stale, lagging, or healthy, and when the last run wrote it.
-
STEP 02
Open the run that wrote it.
Studio draws that run's graph: the compute, each input with the exact values it read at that tick, and the output it produced. Inputs that were overridden are flagged. Data that arrived after the run read its inputs is flagged.
-
STEP 03
Step up the chain.
Each input is itself the output of another compute, with its own run record for the same tick. Open it: the same view, one level up. Hundreds of computes, however many levels — the mechanism is the same at every step, and it works for any run in history, not only the latest.
-
STEP 04
Fix it, and replay.
Correct the expression or the input, rerun the tick from the same panel, or replay a range — with a preview of how many computes the replay will touch before you confirm, and a filter by template.
That is how you QA a number: not by trusting the model, by reading its receipts.
It is the platform page's promise, kept in one place — trace how every value was produced: source, aggregation tier, compute inputs, and replayable units of work. The Data deep dive covers the honesty on the numbers themselves.
THE STATUS, IN FULL
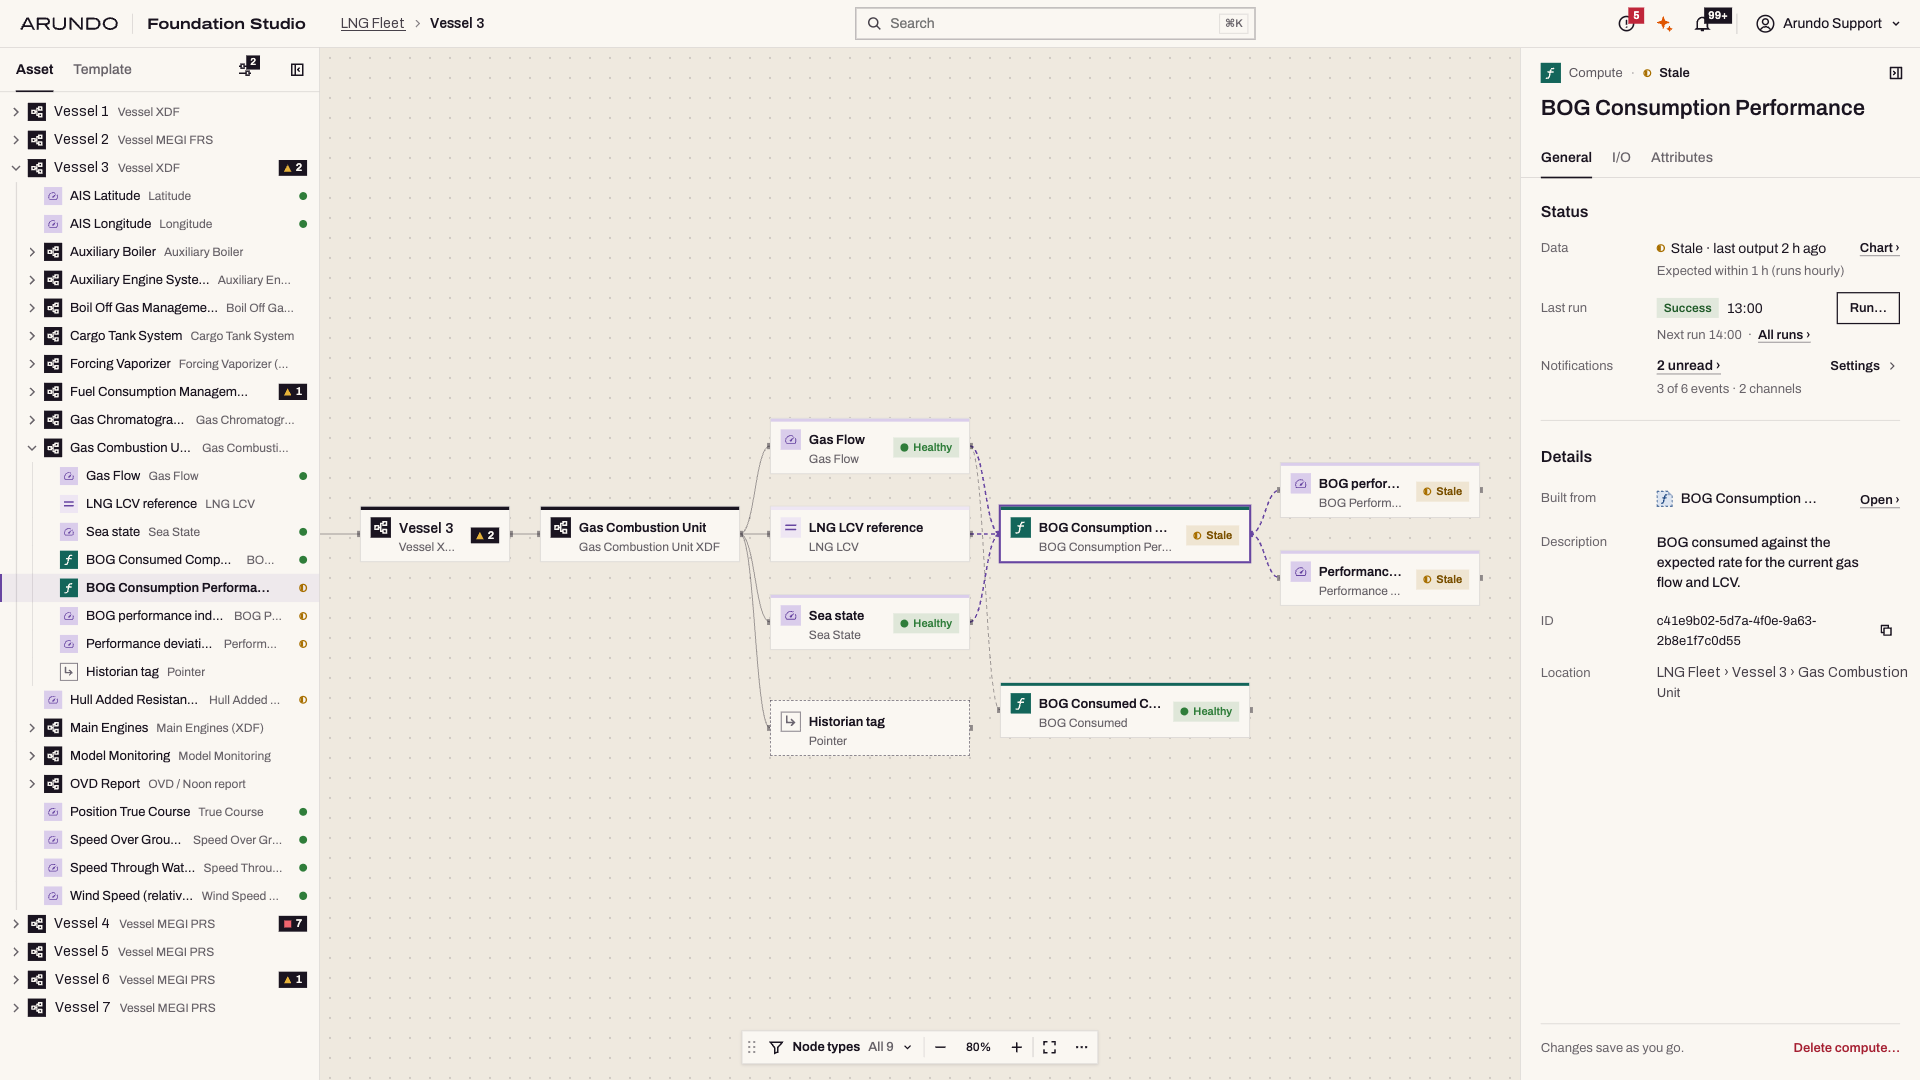
Honest about health
The trace is only useful if the platform tells you when to look. A sensor is healthy, lagging, stale, or offline. A compute is scheduled, running, succeeded, or failed — with partial data and no data called out, not hidden. A data store reports its workers, its queue, and its success rate. The canvas carries the dot; the panel carries the detail.
Diagnostics is a page, not a hunt: every error, warning, and unvalidated entity across sensors, computes, and data stores in one list, filtered by type and severity, with a badge in the navigation when something needs a look. Charts tell the truth at the resolution you ask for — resolution, aggregation, and imputation are explicit controls, and aggregation is only offered when the resolution you ask for is coarser than the data's own. Notifications follow the same rule: watch rules per entity or per template, delivery channels, a delivery log, and a live inbox in Studio — on the alerting substrate that Level 3 recommendations will arrive on.
Build the Domain
A chain you can walk has to be a chain you built in the open. Studio is a visual editor for the whole graph — the same platform as the APIs, through a screen — so the people who know the plant can see the model, question it, and extend it without a deployment. Everything the Domain can hold, you create, inspect, and change here:
- Assets and hierarchies
- site to unit to equipment. The tree on the left is the plant.
- Sensors, pointed at their data
- each sensor points to its series in a connected data store. Data stores are nodes in the graph too, with live connection health; credentials are entered masked and go to the vault, never into the model.
- Templates from assets
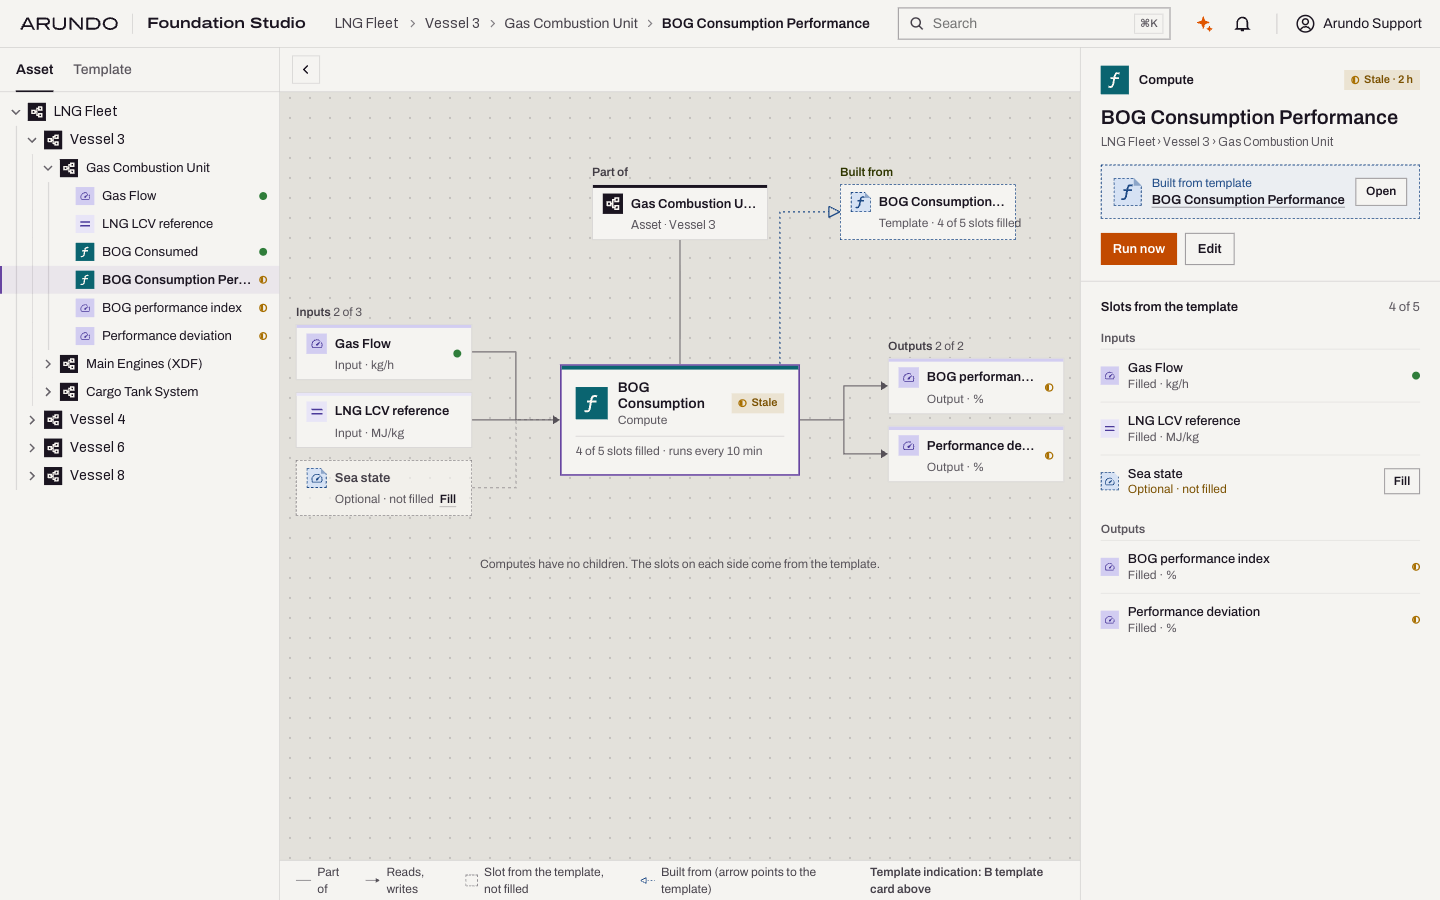
- model one vessel or one turbine with typed, validated attributes, then create a template from it in one dialog. The next ten are instances, not drawings. A badge on the canvas takes you from any instance to its template, and the template lists everything built from it.
- Computes, with an expression editor
- arithmetic for the simple cases, Python for the rest. Inputs, outputs, and parameters are edges in the graph, so every compute knows which assets it reasons about — and every output knows which compute wrote it, which is what makes the chain walkable. Validated and test-run before it is saved.
- Documents on equipment
- upload a manual to the asset it describes; Studio drafts the description for you (see the Documents deep dive).
- Units, complete
- a full registry with aliases, compound and custom units, and a converter. A value's unit travels with it.
Graph view for structure, table view for bulk, global search across every type. Whole-domain export and import moves a Domain between environments in one step.
THE DOMAIN, LIVE
A COMPUTE, BUILT FROM A TEMPLATE
Who it is for
Studio is for the people who know the plant, not only the people who know the stack. Process engineers build and read the model. Data engineers connect the stores and write the harder computes. Operations watches status and notifications, and walks the chain when a number looks off. Nothing in Studio is a second system: every action is a call to the same documented APIs — eight of them, each described in OpenAPI, with a typed TypeScript SDK — so what an engineer does by hand, a script can do at scale. Single sign-on in front of it; users and Domain access managed in Settings; self-service API tokens; English and Norwegian.
Not by trusting the model. By reading its receipts.
What it means for the levels
Level 2 asks for one model of the plant that people and AI reason over together. Studio is how people hold up their end: they can see the model the AI Crew and the MCP servers read, and correct it. Level 3 on The Six Levels of Autonomous Plant Operations (Arundo 2026) is supervised autonomy, and a supervisor needs to be able to ask of any recommendation: show me how you got that. The run ledger is the answer. Foundation is engineered for Level 3; Studio is the window the supervising will be done through.