
FLUSH OPTIMIZER · FOR LUBRICANT PACKAGING LINES
Flush less.
Ship the same quality.
Every changeover on a lubricant packaging line flushes product to protect the next batch — and almost every plant flushes more than it needs to, because the volume comes from habit and a fixed table, not from how contamination actually behaves. The Flush Optimizer models the contamination curve for each transition and recommends the volume that meets spec. 15–30% less flush waste, with quality untouched.
- 15–30%15–30% less flush waste, with quality untouched.
- −18%In production at a global lubricants manufacturer: −18% flush volume, with first-time-right quality maintained.
- Per changeoverrecommends the flush volume that reaches the quality criterion with a controlled margin — instrument-guided, per changeover, in real time.
- Level 2a recommendation per changeover, executed by your operators.
Over-flushing is expensive — and it's a habit, not a law of physics.
Safety margins compound.
Operators add a margin on every changeover, because the cost of a quality miss is visible and the cost of the extra flush isn't. Across hundreds of transitions a year, the wasted product and the slop disposal are a real line item.
Fixed volumes ignore the transition.
A compatibility matrix treats every A→B changeover the same on Tuesday as on Friday; the contamination dynamics don't.
The information already exists.
In-line instruments and the plant's own changeover history contain the contamination curve. Nobody was using them to decide the flush.
A flush volume for this transition, not for transitions in general.
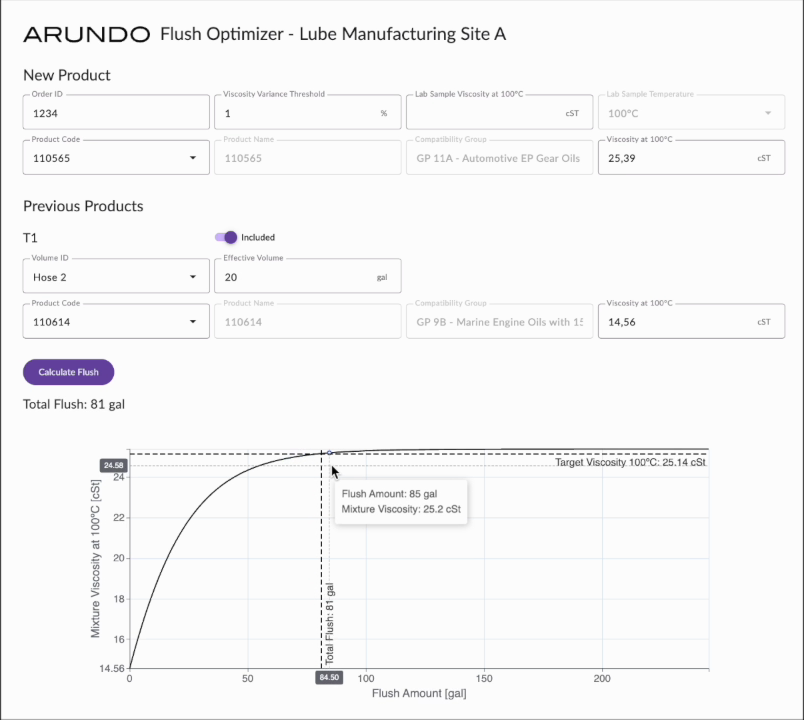
The Flush Optimizer builds a contamination profile per product transition from in-line measurements and the line's history, and recommends the flush volume that reaches the quality criterion with a controlled margin — instrument-guided, per changeover, in real time. Recommendations arrive where the operator makes the decision; as trust builds, execution can move from manual to control-system-executed to closed loop, one step at a time. Every changeover is tracked, so savings are measured, not estimated.
Level 2 on The Six Levels of Autonomous Plant Operations (Arundo 2026): a recommendation per changeover, executed by your operators. Handing execution to the control system is the Level 3 step; closed loop within your quality limits is the bounded Level 4 destination — each step taken only where you choose to.
Less waste. Same spec. Measured every time.
15–30% less flush waste
Modeled contamination replaces guesswork margins.
Lower slop disposal cost
Less flushed product to store, move, and dispose of.
Quality protected
The criterion is the target; the margin is controlled rather than guessed.
Every changeover accounted for
A dashboard that shows recommended vs actual and the savings, transition by transition.
In production at a global lubricants manufacturer: −18% flush volume, with first-time-right quality maintained.
What would it save on your line?
A few questions about the line, an indicative estimate — before anyone from Arundo is involved.
Indicative only. Actual savings depend on product mix, line configuration, execution method, and existing recovery practices.
Want the real number? Bring us a year of changeover data → Free line assessment
See it run.
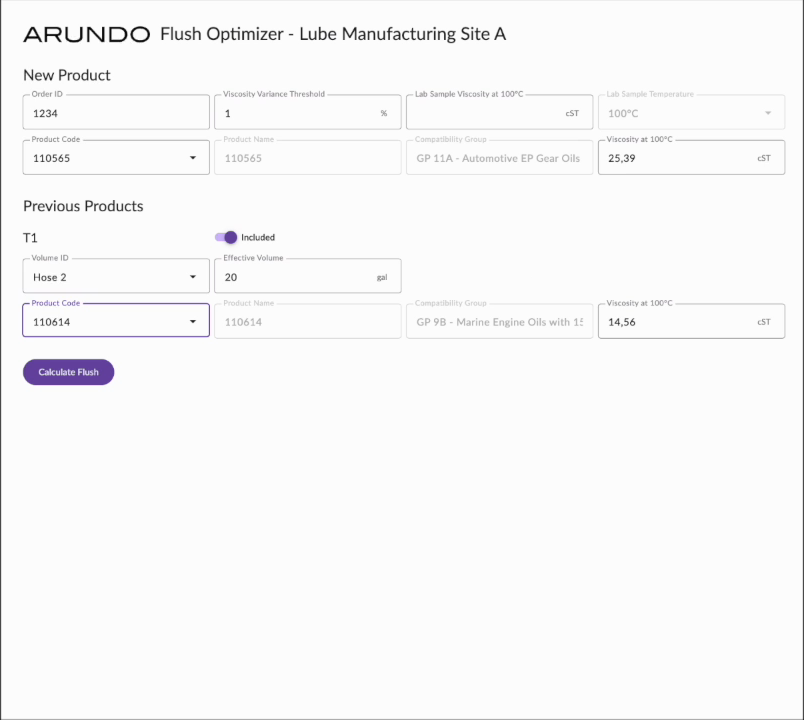
The dashboard: contamination curves per transition, the recommended volume, and savings tracked across every changeover.
Is your line a candidate?
Lubricant and similar packaging lines with frequent product changeovers, a flush step between them, and either in-line instrumentation or a changeover history to learn from. We'll assess fit against your line topology, product portfolio, and information systems — at no cost and no commitment — and tell you plainly if the answer is no.